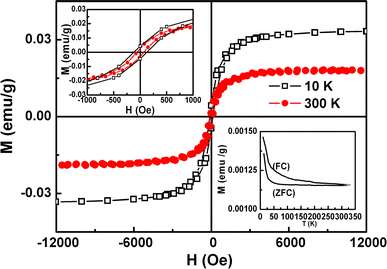
Figure 2.

M-H curves of CuO nanoparticles annealed at 800°C recorded at 10 and 300 K, in which the paramagnetic signal of the sample and the holder have been deducted. The top left inset shows the magnification of the central part for M-H curves and the bottom right inset shows the FC-ZFC curve of CuO nanoparticles annealed at 800°C
