
Figure 8.
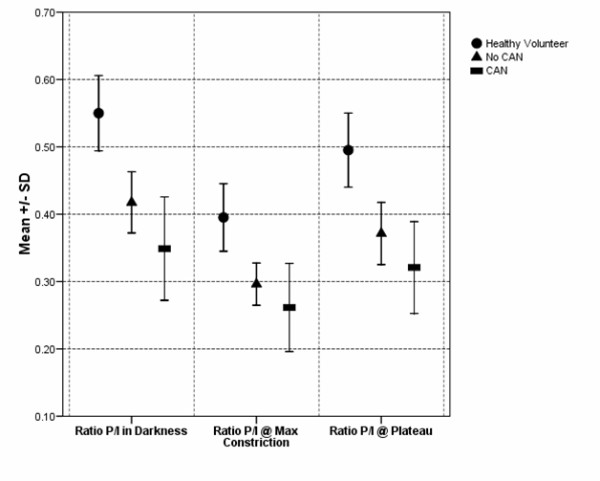
Comparison of mean and standard deviation values of the pupil-iris ratio (P/I) in the largest mydriasis before flash (#7 in Figure 4), at largest miosis (#6 in Figure 4), and during the plateau period (#5 in Figure 4). These values were obtained after one 10-ms light flash in healthy volunteers and diabetic subjects with and without CAN.