
Figure 9.
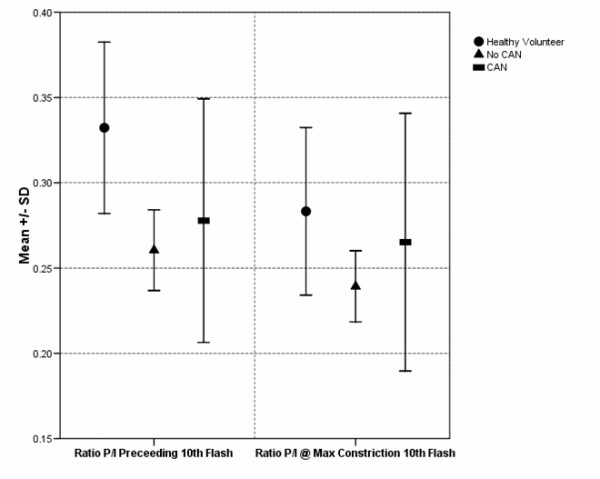
Comparison of mean and standard deviation values of the pupil-iris ratios (P/I) before the 10th flash (#3 in Figure 5) and at the largest constriction (#4 in Figure 5).
Official websites use .gov
A
.gov website belongs to an official
government organization in the United States.
Secure .gov websites use HTTPS
A lock (
) or https:// means you've safely
connected to the .gov website. Share sensitive
information only on official, secure websites.
Comparison of mean and standard deviation values of the pupil-iris ratios (P/I) before the 10th flash (#3 in Figure 5) and at the largest constriction (#4 in Figure 5).