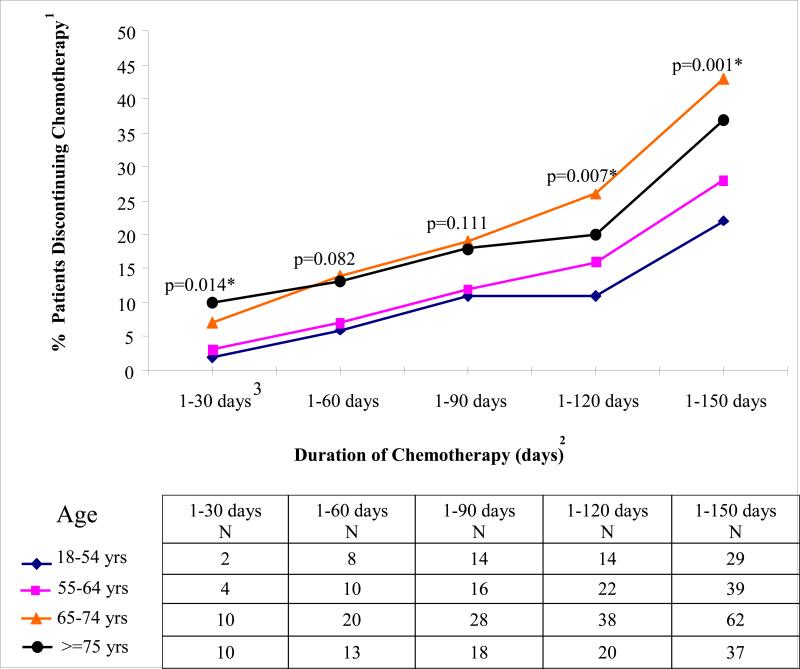
Figure 2. Cumulative Proportions of Patients Discontinuing Chemotherapy by Specified Day by Age.
1Y-axis shows % patients discontinuing chemotherapy at specified time period.
2X-axis shows the time window during which adjuvant chemotherapy is discontinued. For each age-specific curve, the data points show the % patients who have discontinued adjuvant chemotherapy by the end of the specified time window. Across all of the time windows listed in the x-axis, the n associated with the denominator is constant and includes all patients who initiate adjuvant chemotherapy (n=513).
3For example, within the time window from 1-30 days following adjuvant chemotherapy initiation, across respectively increasing age categories, 2, 3, 7, and 10% of patients have discontinued treatment (p=0.014).
*p-values indicate differences in probability of chemotherapy discontinuation by age for surviving patients as of 30, 60, 90, 120, and 150 days after chemotherapy initiation using Cox proportional hazard model. As noted, older patients are significantly more likely to discontinue chemotherapy at all time points (i.e., 30, 60, 90, 120, and 150 days). Note that the % patients having last chemotherapy date as of 180 days does not differ by age.(not shown).

