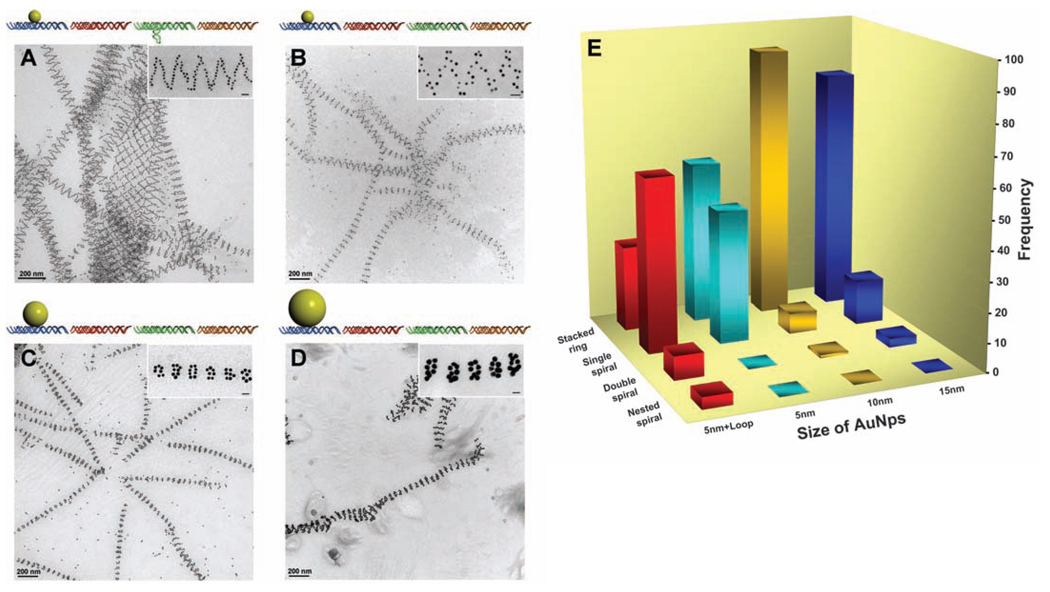
Fig. 2.
Steric effects on the tube architectures. (A) Schematics and TEM images showing the tubes formed from DNA tile arrays with 5-nm AuNP on the A tile and a DNA stem loop on the C tile (same sample but a different imaging area as shown in Fig. 1E). (B) Schematics and TEM images showing the tubes formed from DNA tile arrays with only 5-nm AuNPs on A tiles without stem loops on C tiles. (C) Schematics and TEM images showing the tubes formed from DNA tile arrays with 10-nm AuNPs on A tiles. (D) Schematics and TEM images showing the tubes formed from DNA tile arrays with 15-nm AuNPs on A tiles. These TEM images are 2D projections of flattened tubular structures. (E) Histogram showing the distribution of tube types observed for the four samples from (A) to (D). One hundred tubes were randomly counted and analyzed from nonoverlapping images for each sample. Additional images are shown in (28). Each image contains a magnified representative tube from each sample. The scale bars in the inserts are all 20 nm.

