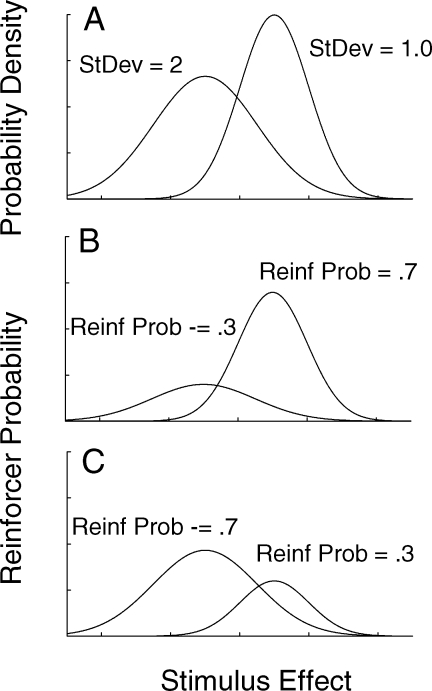
Fig. 8.
Illustration of the model described by White and Wixted (1999) where distributions of reinforcer probability (Panels B and C) are determined by multiplying the probability density distributions of stimulus effect for two samples (Panel A) by arranged reinforcer probabilities. At any value x on the stimulus effect dimension, the choice between response alternatives is determined by the proportion of the heights of the two reinforcer distributions at x.

