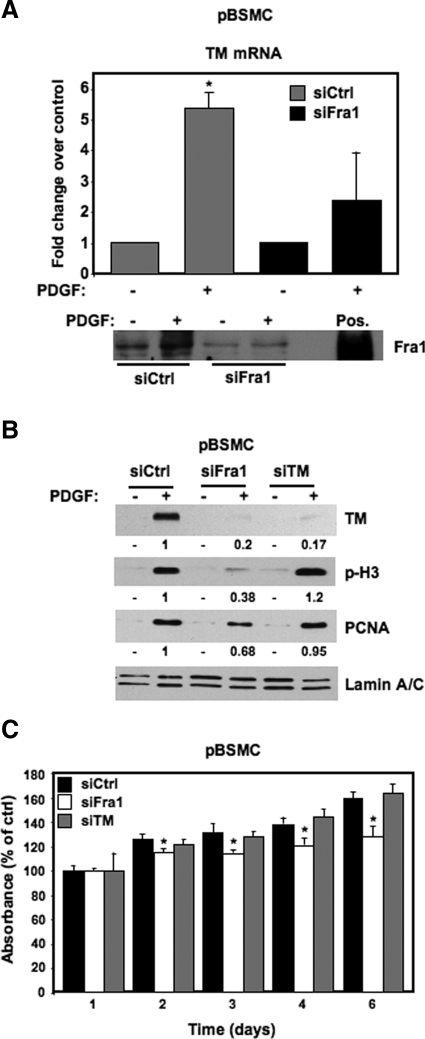
Figure 6.
Fra1 mediates the PDGF-induced activation of TM. A: Real-time RT-PCR of TM mRNA in pBSMC following nucleofection with either nontargeting control siRNA (Ctrl, gray bar) or siRNA targeting Fra1 (black bar), and treatment of serum-depleted cells with vehicle (−) or 30 ng/ml PDGF (+) for 2 hours. The graph shows fold increase in TM mRNA with PDGF treatment relative to control; data are the average of two independent experiments assayed in duplicate. TM mRNA was increased ∼5-fold on PDGF treatment (+) for two hours relative to untreated cells (−) in the Ctrl siRNA condition (P = 0.009). Knockdown of Fra1 decreased the PDGF-mediated induction of TM mRNA levels, such that the effect of PDGF was no longer significant (P = 0.28). An immunoblot showing Fra1 protein levels in pBSMC 48 hours after nucleofection of control or Fra1 siRNA, and subsequent treatment with 30 ng/ml PDGF for two hours is shown below the graph. Lysate from HEK293 cells transfected with a Fra1 expression construct was used as a positive control (Pos.) to verify the position of the Fra1 protein on the blot. B: Fra1 knockdown in pBSMC ablates the PDGF-mediated increase in TM protein as well as markers of cell proliferation. Twenty-four hours after nucleofection of pBSMC with control, Fra1- or TM-targeting siRNAs, cells were serum depleted for 24 hours, and subsequently treated with 30 ng/ml PDGF or vehicle for 48 hours. PDGF caused a robust increase in TM, p-H3, and PCNA levels in the control siRNA-transfected cells. The PDGF-stimulated increase in TM expression was significantly reduced by both Fra1 and TM knockdown. Fra1 knockdown also attenuated the PDGF-induced increase in p-H3 and PCNA levels, whereas cells in which TM was knocked down showed no appreciable change in p-H3 or PCNA up-regulation in response to PDGF. The values represent quantification of the change in PDGF-induced TM, p-H3, and PCNA levels with Fra1 or TM silencing relative to the nontargeted control. C: The effect of Fra1 or TM knockdown on pBSMC proliferation was determined over time using the crystal violet biomass assay. pBSMC nucleofected with siRNA duplexes against Fra1 or TM or with nontargeting siRNA were assayed for up to six days. Data are presented as absorbance expressed as a percentage of control (absorbance at the start of the experiment) and represent mean ± SD of six replicates. Fra1 knockdown led to reduced biomass at days 2–6 (*P < 0.05, siFra1 relative to siCtrl).

