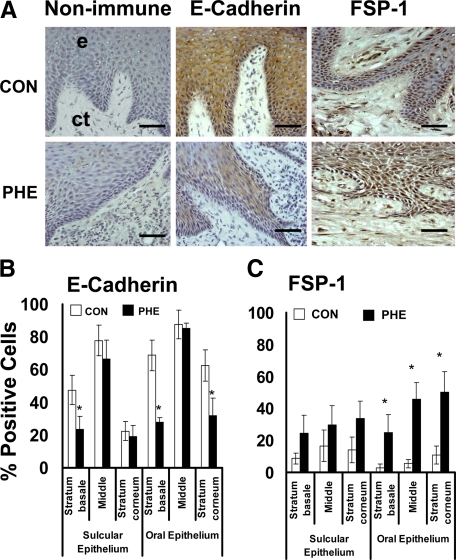
Figure 2.
E-cadherin and FSP-1 expression in phenytoin-induced gingival overgrowth and no overgrowth control tissues. A: Representative sections from oral epithelium (e) and suboral connective tissue (ct) of immunohistochemistry staining of phenytoin induced gingival overgrowth (PHE) and no overgrowth control (CON) tissues; Scale bar = 35 μm, at ×400 magnification. B: Histomorphometric and quantitative analyses of E-cadherin immunostaining in phenytoin induced gingival overgrowth (PHE) in different areas of gingival epithelium (0.09 mm2) compared with no overgrowth control tissues (CON). C: Histomorphometric and quantitative analyses of FSP-1 immunostaining in phenytoin induced gingival overgrowth tissues (PHE) in different areas of gingival epithelium compared with no overgrowth control (CON) tissues; n = 11 in control, n = 7 in phenytoin. Data are means ± SE; *P < 0.05 compared with control by analysis of variance with Bonferroni correction for multiple tests.

