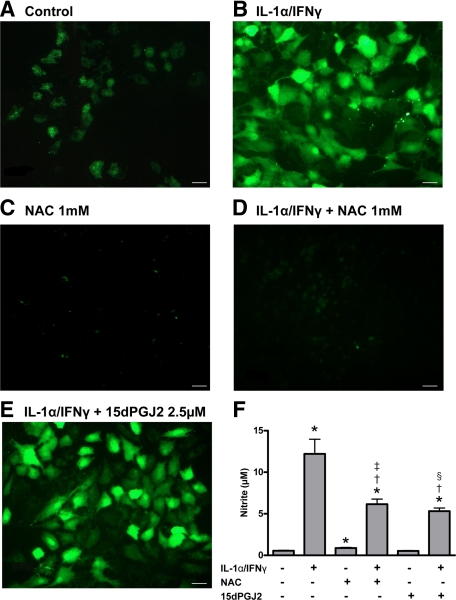
Figure 1.
Detection of intracellular ROS in PCCL3 cells (A–E). ROS production was measured in control cells (A), in IL-1α/IFNγ-treated cells (B), in NAC-treated cells (C), in IL-1α/IFNγ-treated cells co-incubated with NAC (D), and with 15dPGJ2 (E). Scale bars = 200 μm. Nitrite accumulation in the culture medium of human thyrocytes (F) is shown. Results are expressed as mean ± SEM of six individual wells of one representative experiment (n = 6). *P < 0.05 versus control cells; †P < 0.05 versus IL-1α/IFNγ-treated cells; ‡P < 0.05 versus NAC-treated cells; §P < 0.05 versus 15dPGJ2-treated cells.

