Figure 3.
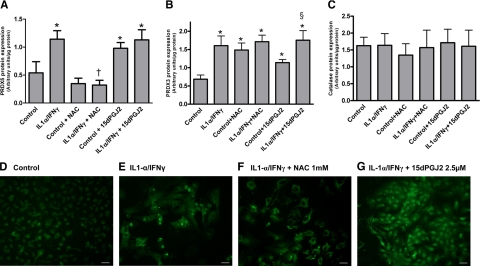
Expression of PRDX5, PRDX3, and catalase antioxidant enzymes. Quantification of PRDX5 (A), PRDX3 (B), and catalase (C) protein expression in PCCL3 cells. Densitometric values of Western blots are expressed as mean ± SEM of one representative experiment (n = 6). *P < 0.05 versus control cells; †P < 0.05 versus IL-1α/IFNγ-treated cells; §P < 0.05 versus 15dPGJ2-treated cells. Immunofluorescence of PRDX5 in PCCL3 cells in control (D), in IL-1α/IFNγ-treated cells (E), in IL-1α/IFNγ-treated cells co-incubated with NAC (F), and in IL-1α/IFNγ-treated cells co-incubated with 15dPGJ2 (G). Scale bars = 200 μm.

