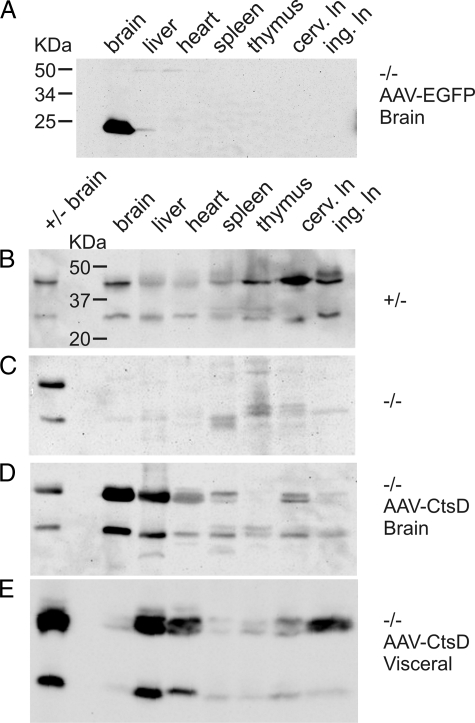
Figure 5.
Quantitative analysis of viral vector spread and CtsD delivery to CNS and visceral tissues. Representative Western blot for detection of EGFP in visceral tissues after CNS injection of AAV-EGFP into CtsD−/− mice is shown (A). Western blot analysis of CtsD levels at p22 is shown for control mice (B), for untreated −/− mice (C), for −/− mice injected into CNS with AAV-CtsD (D), and for −/− mice injected into periphery with AAV-CtsD (E). Each blot shown is representative of tissue analysis of n = 3 animals per condition. Blot A was probed with an anti-EGFP antibody, blots B–E were probed with an anti-CtsD antibody. In B–E a size standard for CtsD from control brain was used to distinguish CtsD immunoreactivity from background signals. Please note that in E a batch of standard containing higher protein concentration than those used in B–D was used. Otherwise, each lane of the Western blots represents 40 μg of loaded protein.

