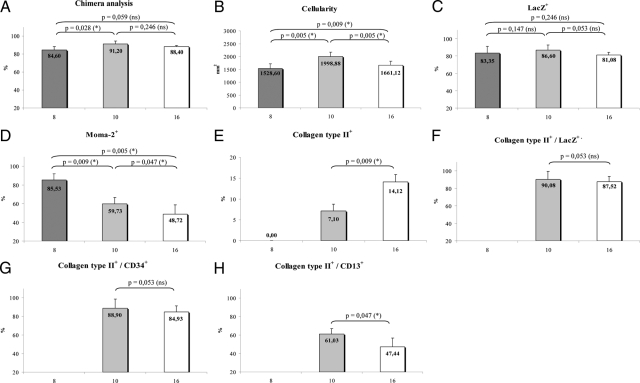
Figure 1.
Graphs displaying results with x-axis showing the duration of high-fat diet (weeks). A: Percentage of LacZ+ cells in peripheral blood. B: Total plaque cellularity, cells per square millimeter of lesion area. C: Percentage of LacZ+ cells of total plaque cellularity. D: Percentage of MOMA-2+ cells. E: Percentage of collagen type II+ cells. F: Percentage of collagen type II+ cells additionally expressing LacZ. G: Percentage of collagen type II+ cells additionally expressing CD13. H: Percentage of collagen type II+ cells additionally expressing CD34. *P < 0.05; ns, P ≥ 0.05.

