Figure 3.
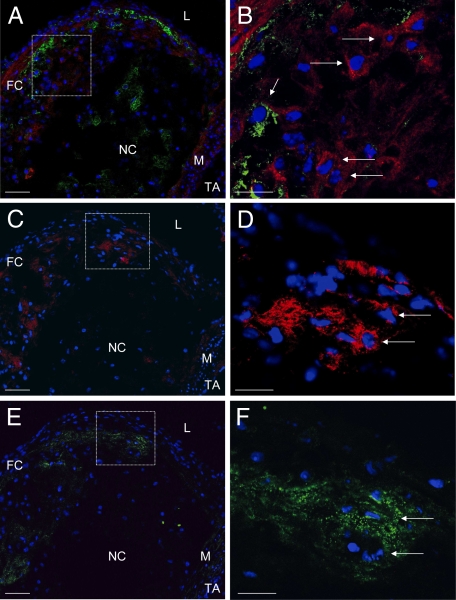
Collagen type II costaining with Hoechst 33258 and MOMA-2 (A and B), collagen type II staining with Hoechst 33258 (C and D), and RANKL costaining with Hoechst 33258 (E and F) of serial sections of aortae from C57BL/6 LDL−/− mice (16 weeks high-fat diet). A, C, and E: L indicates lumen; FC, fibrous cap; NC, necrotic core; M, tunica media; A, tunica adventitia. A: Collagen type II staining (red immunofluorescence), MOMA-2 staining (green immunofluorescence), and blue fluorescence Hoechst 33258. B: Higher magnification of the area demarcated in A. Long arrows indicate collagen type II+ chondrocyte-like cells without evidence of MOMA-2. Short arrow indicates MOMA-2+ cell. C: Collagen type II staining (red immunofluorescence) and blue fluorescence by Hoechst 33258. D: Higher magnification of the area demarcated in C. Long arrows indicates collagen type II+ chondrocyte-like cells. E: RANKL staining (green immunofluorescence) and blue fluorescence by Hoechst 33258. F: Higher magnification of the area demarcated in E. Long arrows indicates RANKL+ cells. Collagen type II+ cells are located within the RANKL+ area. Scale bar = 50 μm (A, C, and E); 20 μm (B, D, and F).

