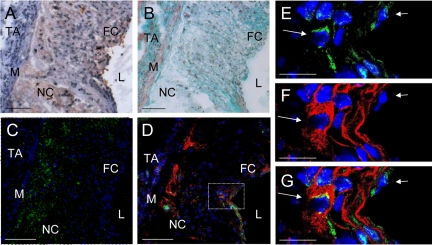
Figure 5.
Chondrocyte-like cells within atherosclerotic plaques of aortas from C57BL/6 LDL−/− mice (16 weeks high-fat diet). A: Oil-Red O staining (fat = red, nuclei = purple). B: Masson-Goldner trichrome staining (nuclei = blue-black, cytoplasm = red, collagen = green, muscle-tissue = bright red). C: Calcein staining (calcium phosphate = green fluorescence, nuclei = blue fluorescence as produced by the DNA-binding dye Hoechst 33258). D: Collagen type II costaining with Hoechst 33258 and CD34 of chondrocyte-like cells. Collagen type II staining (red immunofluorescence), CD34 staining (green immunofluorescence), and blue fluorescence Hoechst 33258. L indicates lumen; FC, fibrous cap; NC, necrotic core; TA, tunica adventitia; M, tunica media. Scale bar = 100 μm (A–D). E–G: Higher magnification of the area demarcated in D. E: Green channel; F: red channel; and G: red and green channel. Long arrow indicates collagen type II+/CD34+ chondrocyte-like cell. Short arrow indicates CD34+ endothelial cell. Scale bar = 20 μm (E and F).

