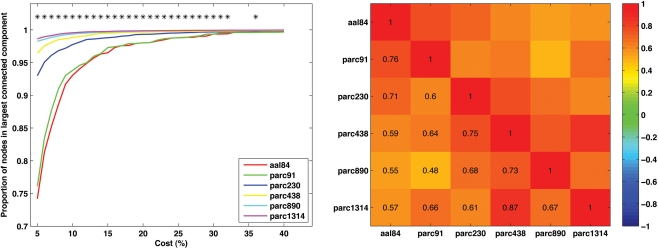
Figure 4.
Mean values and individual differences in network connectedness as a function of parcellation scale. Left: Sample mean size of largest connected network component for each parcellation scale across all costs examined (*p < 0.05). Right: correlation matrix of inter-scale associations for the cost at which each individual's network became connected.

