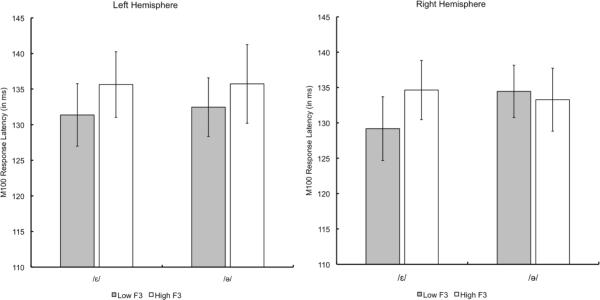
Figure 5. Experiment 1: M100 Response Latencies by Vowel Type.
Mean M100 response latencies across participants to the vowel tokens in Experiment 1. Gray bars refer to tokens with a Low F3 (large F1/F3 ratio) and white bars refer to tokens with a high F3 (small F1/F3 ratio). Error bars represent one standard error of mean.

