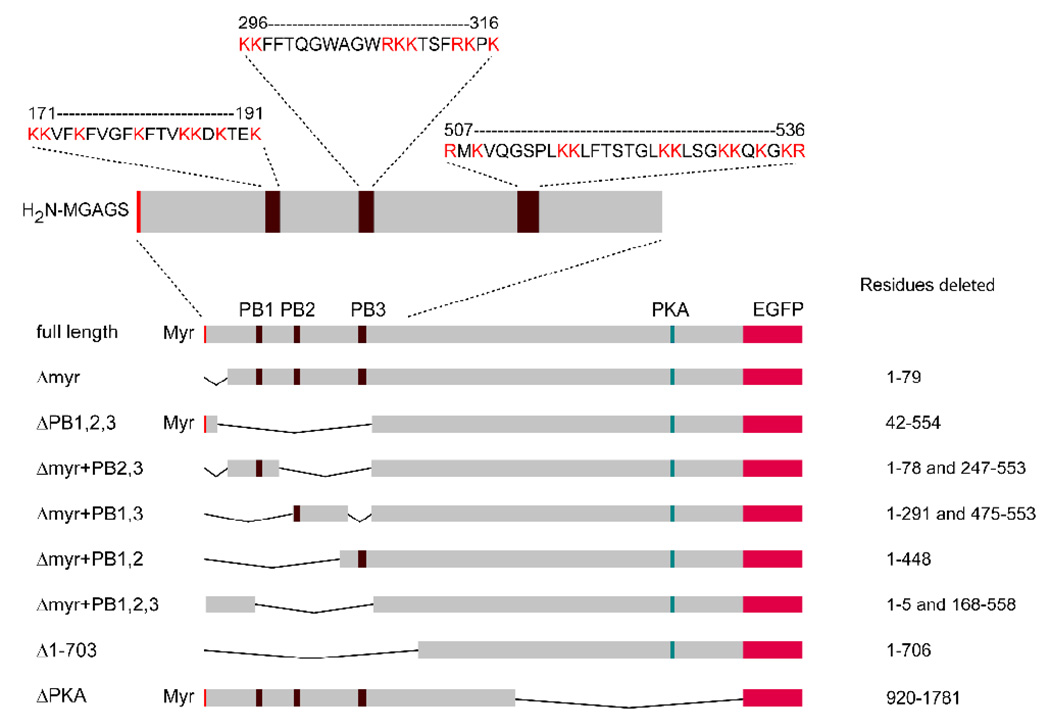
Figure 1.
Schematic diagram showing the position of the myristoylation site and the three polybasic regions (Myr, PB1, PB2 and PB3) in the full-length gravin and maps of the gravin-EGFP fusion protein constructs used in this study. The positions of deleted residues are also shown to the right of each construct.

