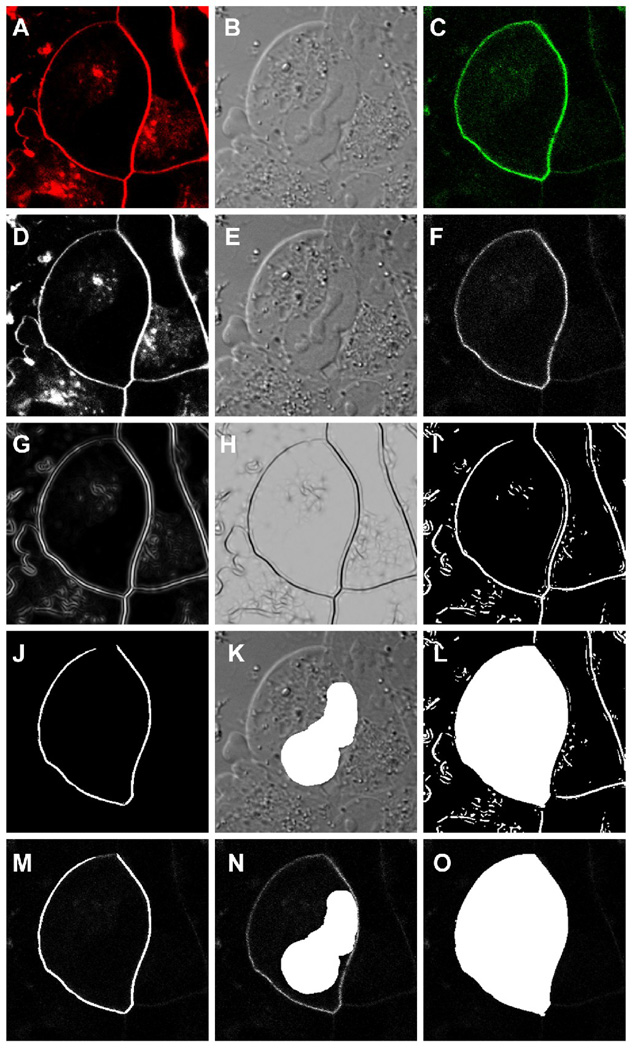
Figure 2.
A series of micrographs demonstrating the image processing steps used in the quantitative analysis of gravin distribution. A multi-channel confocal image captured at the level of the nucleus of a cell was split into the FM4-64 dye (red), the DIC and the gravin-EGFP (green) images (A, B and C respectively) and then converted to 8-bit grayscale images (D, E and F respectively) using Image J software. The 8-bit FM4-64 image was processed using a Hessian filter (Feature J plug-in) (G, H) and then the threshold of the resulting image was adjusted to highlight the plasma membrane region (I). This image was used to generate the region of interest for the membrane (J) and the entire cell (L). The nuclear ROI was defined by hand (K). All three ROIs were then superimposed onto the 8-bit grayscale EGFP image (F) for fluorescence intensity measurements (M, N and O).

