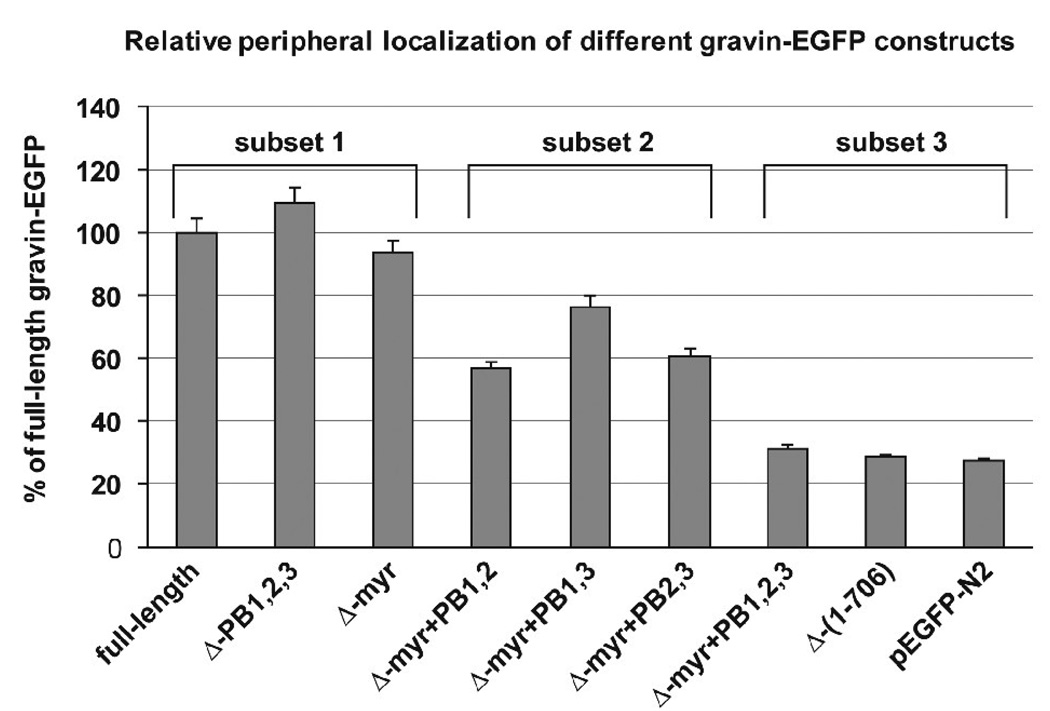
Figure 8.
A graph showing the relative EGFP fluorescence intensity at the cell periphery in cells transfected with the different gravin constructs. Values are plotted as a percentage of the relative peripheral fluorescence observed in cells expressing the full length gravin-EGFP construct. Statistical analysis (One way ANOVA followed by Scheffe post-hoc test) indicates that the samples fell into three statistically distinct subsets (subsets 1, 2, and 3) consisting of (1) full-length gravin, Δmyr gravin and ΔPB1,2,3 gravin, (2) gravin constructs lacking the myristoylation site and any two of the polybasic domains, and (3) gravin constructs lacking both the myristoylation site and all three polybasic domains or EGFP alone. Constructs in subsets 1 and 2 displayed significantly greater peripheral localization than the constructs in subset 3 (p<0.01). Error bars represent the standard deviation for each treatment set.

