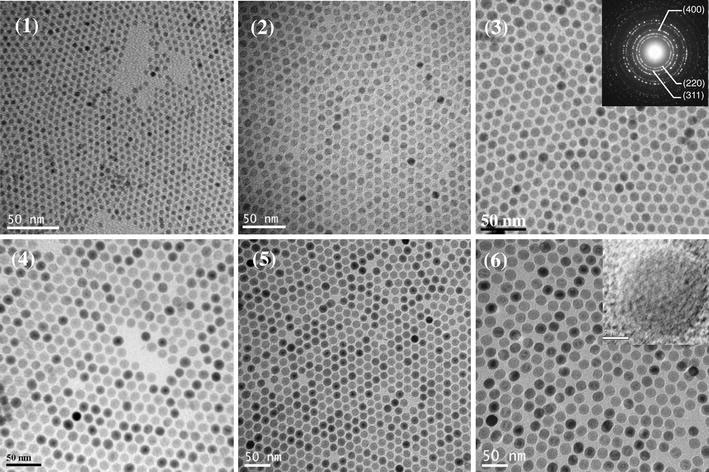
Figure 4.

TEM micrographs of NPs obtained from decomposition of IFAC in different high-boiling-point solvents. Note that micrographs 1–6 correspond to runs 1–6 in Table 1. Note also the uniform size of the NPs in each sample. (Inset: typical electron diffraction pattern and high-resolution TEM showing consistent lattice fringe.)
