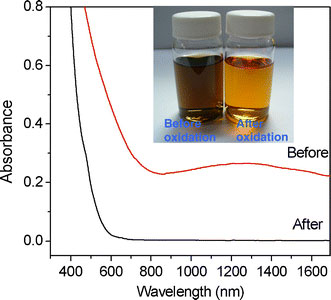
Figure 7.

Absorption spectra of NPs produced in run 6 sample (20.4 nm) before and after oxidation, respectively. Before: the NPs are brown-black in color and show a hump in the IR range due to the intervalence charge transfer of magnetite and an absorption edge in the range 600–800 nm due to the presence of wustite. After: the oxidized NPs areredin color and have zero absorbance above 600 nm due to the oxidization of the Fe3O4and wustite contents
