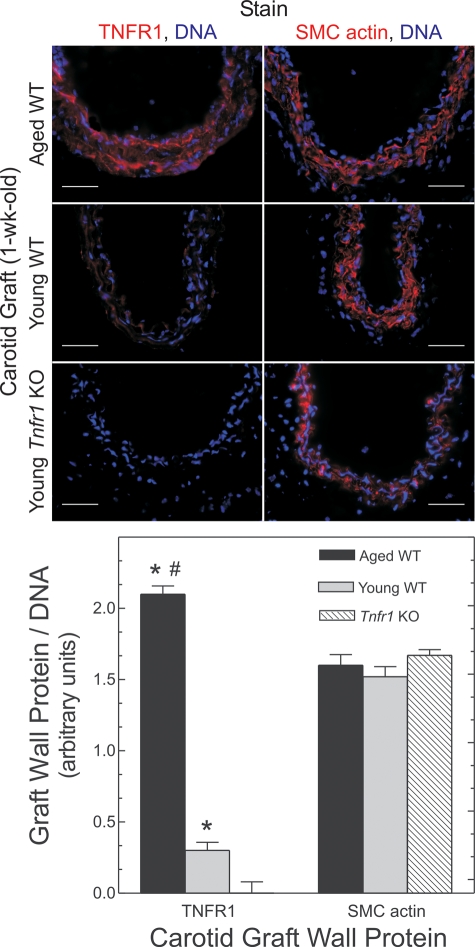
Figure 6.
Aging upregulates arterial TNFR1 expression. Carotid grafts from mice of the indicated age and genotype were harvested 1 week post-operatively, immunostained for the indicated proteins and counterstained for DNA (blue). Data were quantitated as in Figure 3; means ± SE from four or more arteries are presented. Relative to Tnfr1−/− (‘KO’) grafts: *P < 10−4; relative to young WT grafts: #P < 10−3. Lumen is upward. Scale bars: 50 μm (original magnification ×440).

