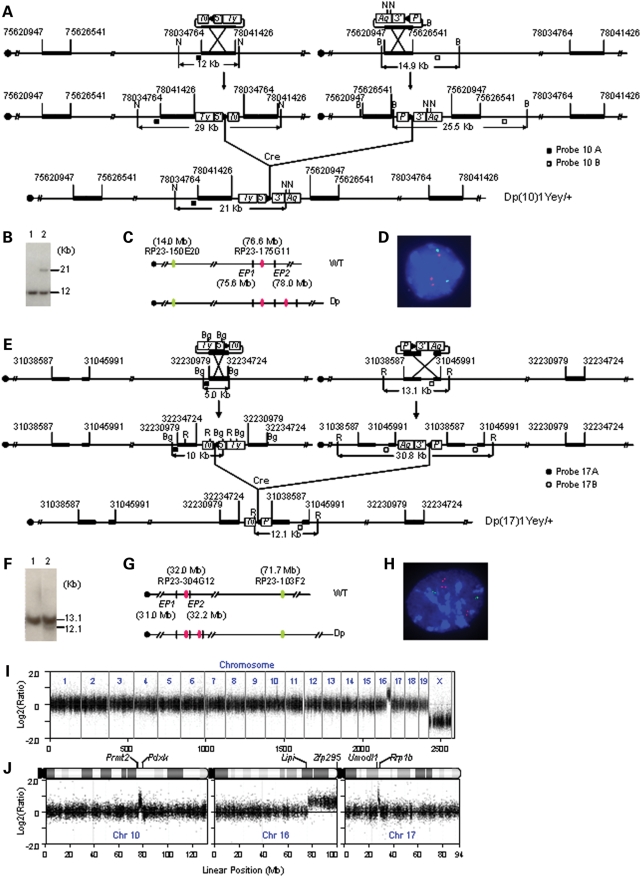
Figure 2.
Development of Dp(10)1Yey/+;Dp(16)1Yey/+;Dp(17)1Yey/+ mice. (A) Strategy to generate Dp(10)1Yey. B, BamHI; N, NheI; 5′, 5′HPRT fragment; 3′, 3′HPRT fragment; N, neomycin-resistance gene; P, puromycin-resistance gene; Ty, Tyrosinase transgene; Ag, Agouti transgene; arrowhead, loxP site. (B) Southern blot analysis of NheI-digested mouse-tail DNA using Probe 10B. Lane 1, the wild-type mouse; lane 2, Dp(10)1Yey/+ mouse. (C) Schematic of the genomic locations of BAC probes for FISH analysis. EP1 and EP2, endpoint 1 and endpoint 2, which were targeted with pTV(10)1EP1 and pTV(10)1EP2, respectively. (D) FISH analysis of interphase nuclei prepared from the embryonic fibroblasts carrying Dp(10)1Yey/+. (E) Strategy to generate Dp(17)1Yey. R, EcoRI; Bg, BglII. (F) Southern blot analysis of EcoRI-digested mouse-tail DNA using Probe 17A. Lane 1, the wild-type mouse; lane 2, Dp(17)1Yey/+ mouse. (G) Schematic of the genomic locations of BAC probes for FISH analysis. EP1 and EP2, endpoint 1 and endpoint 2, which were targeted with pTV(17)1EP1 and pTV(17)1EP2, respectively. (H) FISH analysis of interphase nuclei prepared from the embryonic fibroblasts carrying Dp(17)1Yey/+. (I) Whole-genome Agilent microarray CGH profile of DNA isolated from a Dp(10)1Yey/+;Dp(16)1Yey/+;Dp(17)1Yey/+ mouse. (J) CGH profile of the mouse chromosomes 10, 16 and 17 of the Dp(10)1Yey/+;Dp(16)1Yey/+;Dp(17)1Yey/+ mouse. Plotted are log2-transformed hybridization ratios of Dp(10)1Yey/+;Dp(16)1Yey/+;Dp(17)1Yey/+ mouse DNA versus wild-type mouse DNA.

