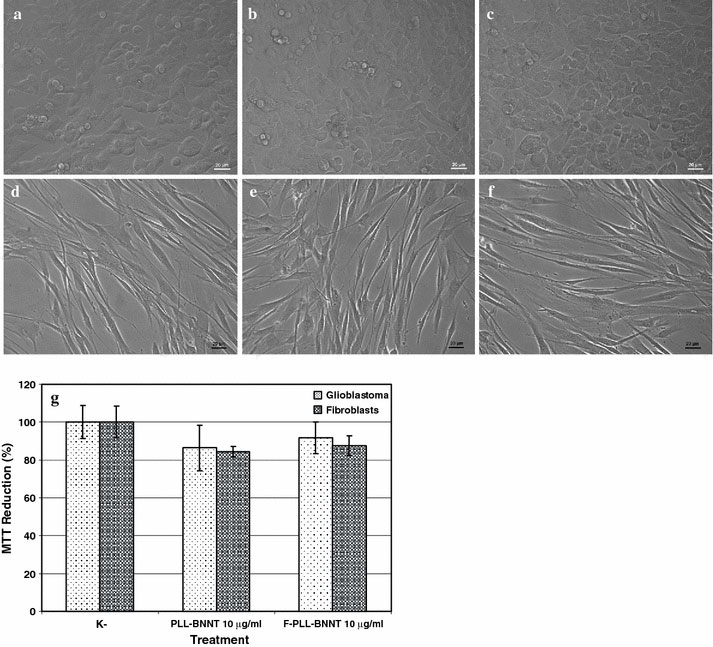
Figure 3.

Morphology, after 24 h of treatment, of glioblastoma control culture (a); glioblastoma incubated with 10 μg/mL of PLL-BNNTs (b); glioblastoma incubated with 10 μg/mL of F-PLL-BNNTs (c); fibroblast control culture (d); fibroblasts incubated with 10 μg/mL of PLL-BNNTs (e); fibroblasts incubated with 10 μg/mL of F-PLL-BNNTs (f); and MTT results for all the tests (g)
