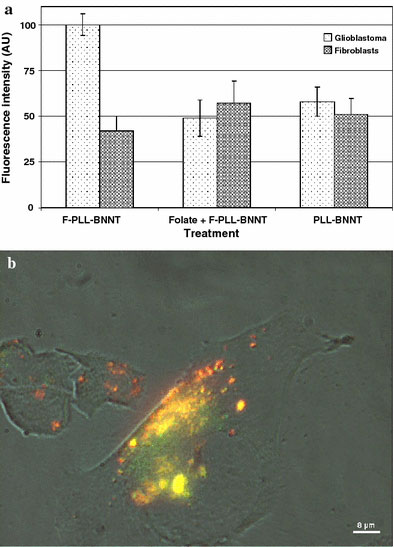
Figure 6.

Quantitative analysis of the fluorescence of glioblastoma and fibroblast cells following the three different treatments (a); high-magnification image of a glioblastoma multiforme cell following uptake of Qdot conjugated F-PLL-BNNTs and lysosomal tracking (b). Yellow fluorescence arises from merging of Qdot (red) and LysoTracker probe (green)
