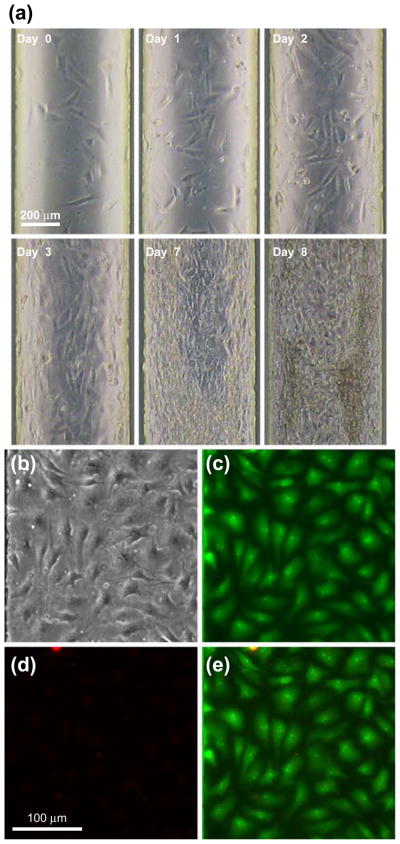
Fig. 3.
Long term culture of NIH 3T3 cells in a Cell-μChip. (a) Time lapse images of the NIH 3T3 cell proliferation in the microchip in a duration of 8 days. (b)–(e) Dead (PI)/live (AO) staining of NIH 3T3 cells cultured in a Cell-μChip for 4 days. (b) A bright field micrograph of NIH 3T3 cell morphologies. (c) A green fluorescence micrograph of the live-stained cells. (d) A red fluorescence micrograph of the dead-stained cells. (e) A merged fluorescence image of (b) and (c)

