
Figure 4.
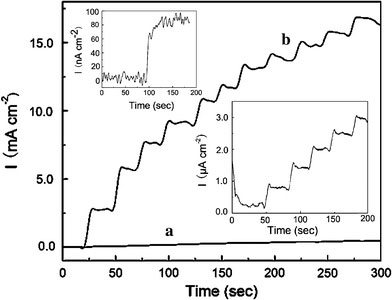
Current–time curve of the conventional gold electrode (a) and gold NEA (b) to the successive addition of 1 mM hydrogen peroxide at 0.6 V in PB. The insert (right) shows current–time curve of the gold NEA to the successive addition of 1 μM hydrogen peroxide. The insert (left) shows detection limit of 100 nM with S/N = 4