FIG. 1.
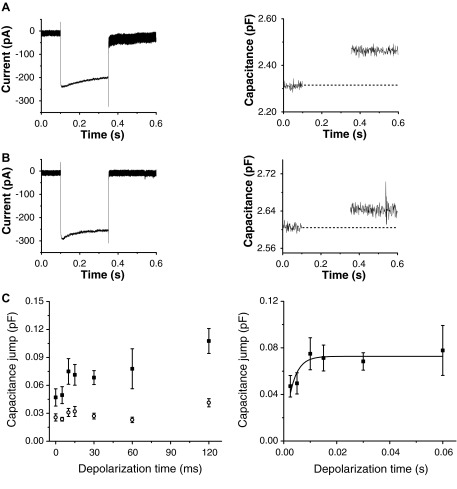
Exocytosis as a function of depolarization step length. A, left, raw current signal from a bipolar cell terminal loaded with 0.5 mM ethylene glycol tetraacetic acid (EGTA) and depolarized from −60 to 0 mV for 250 ms. A, right: raw capacitance signal from the same terminal as at left. B, left, raw current signal from a bipolar cell terminal loaded with 10 mM EGTA and depolarized from −60 to 0 mV for 250 ms. B, right: the raw capacitance signal from the same terminal as at left. C, left: composite data from all terminals. Number of terminals loaded with 0.5 mM EGTA (black squares) by stimulus duration: 5 ms (n = 8), 10 ms (n = 6), 15 ms (n = 19), 30 ms (n = 7), 60 ms (n = 7), and 120 ms (n = 6). Number of terminals loaded with 10 mM EGTA (red circles) by stimulus duration: 5 ms (n = 8), 10 ms (n = 8), 15 ms (n = 10), 30 ms (n = 10), 60 ms (n = 8), and 120 ms (n = 6). C, right: composite data from terminals loaded with 0.5 mM EGTA and depolarized for indicated times. Red curve shows a single-exponential fit to these data using OriginLab 7.5. The curve had R2 = 0.96 and τ = 2.9 ms.

