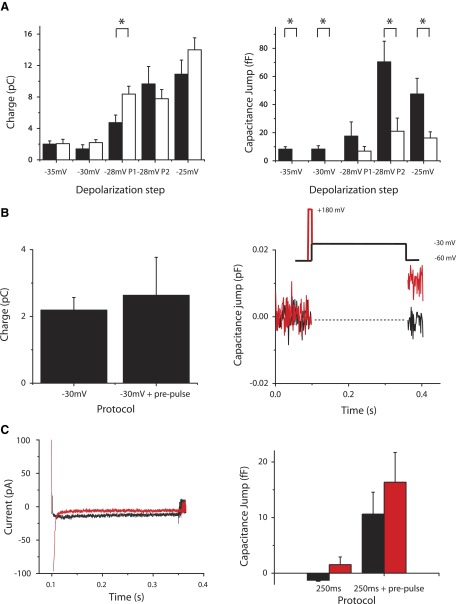
FIG. 5.
Comparison of physiological membrane depolarizations using 0.5 or 10 mM EGTA. A, left: charge introduced during depolarizations as a function of the step depolarization protocol. Black bars (leftmost within protocol) represent terminals loaded with 0.5 mM EGTA; white bars (rightmost within protocol) represent terminals loaded with 10 mM EGTA. Comparing terminals within protocols shows that for −28-mV P1 step depolarizations the charge is significantly larger for 10 mM EGTA-loaded terminals. A, right: capacitance jump as a function of the step depolarization protocol. Black bars (leftmost within protocol) represent terminals loaded with 0.5 mM EGTA; white bars (rightmost within protocol) represent terminals loaded with 10 mM EGTA. Comparing terminals within protocols shows that for all protocols except −28-mV P1 step depolarizations, the capacitance jump is significantly larger for 0.5 mM EGTA-loaded terminals. B, left: charge introduced during a step depolarization to −30 mV compared with that introduced during a step depolarization to −30 mV that was immediately preceded by a 5-ms prepulse to +180 mV, to introduce a calcium tail current (−30-mV tail). B, right: capacitance change due to a simple 250-ms step depolarization to −30 mV (black trace) compared with the capacitance change elicited by a 250-ms step depolarization to −30 mV immediately preceded by a 5-ms prepulse to +180 mV (red trace). C, left: current records from representative terminals stimulated with a step depolarization from −60 to −30 mV for 250 ms (black trace) or stimulated with a step depolarization from −60 to −30 mV for 250 ms immediately preceded by a 5-ms depolarization to +180 mV (red trace). These currents gave rise to capacitance changes of −1.4 fF (terminal from black trace) and 4.6 fF (terminal from red trace). C, right: capacitance jump comparing simple 250-ms step depolarizations to step depolarizations with 5-ms prepulse to +180 mV. Black bars are from terminals loaded with 10 mM and depolarized to −30 mV. Red bars are from terminals loaded with 15 mM EGTA and 7.5 mM Ca2+, to give a measured internal [Ca2+] of about 300 nM (see methods).

