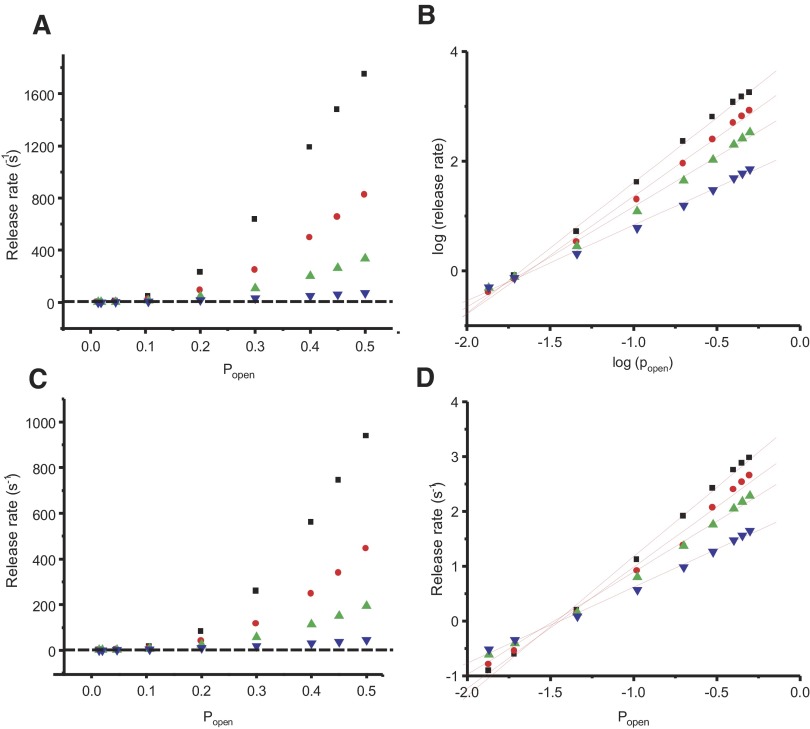
FIG. 9.
Exocytic rate compared with calcium channel open probability calculated using a multiple-channel model. A: linear plot of vesicle release rate compared with channel open probability (Popen) as calculated by the model, assuming release sites are equidistant from 2 (blue triangles), 5 (green triangles), 10 (red circles), or 20 (black squares) calcium channels, assuming 0.5 mM EGTA. The model calculates the calcium concentration as a function of distance from each number of channels. The traces in A are chosen to have a separation (to the nearest nm) between the channels and release sites that gave a release rate (0.37 s−1) closest to our capacitance measurements at −30 mV at lowest open probability (0.014). B: log–log plot of data in A. Red lines indicate best-fit lines through the data. The slopes of the lines were the following: 1.38 for 2 channels, 1.83 for 5 channels, 2.15 for 10 channels, and 2.38 for 20 channels. C: same as in A, except model calculates release rates in the presence of 10 mM EGTA. The same channel-release site separation distances are used as in A. D: log–log plot of data in C. Lines are linear best-fit curves through the data. The slopes were the following: 1.39 for 2 channels, 1.87 for 5 channels, 2.21 for 10 channels, and 2.54 for 20 channels. Symbols in B through D are the same as in A.

