Figure 5.
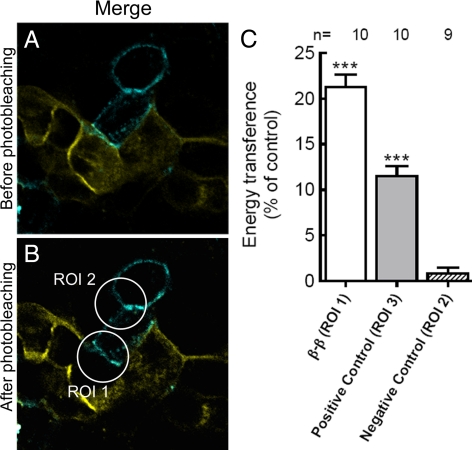
Interaction between β1 subunits observed by FRET after the in vivo acceptor photobleaching assay. (A) Fluorescence image captured before acceptor photobleaching in cocultures of MRβ CFP (cyan) and MRβ YFP (yellow) living cells. The optical merge shows the colocalization of both fluorescent proteins in cell-cell contact areas (green). (B) Fluorescence of the same optical section after photobleaching of the YFP in a membrane section that possessed both CFP and YFP expression. ROI 1 was the region used for quantification of %E. Bleaching of YFP in this region increased the fluorescence of CFP. ROI 2 was the region used as an internal negative control, in which the change of CFP fluorescence was also measured. Bar, 20 μm. (C) Quantification of %E. The percentage of energy transference obtained in 10 experiments was averaged. Bars represent SEM and asterisks indicate p < 0.001 with respect to negative control. ROI 3 is from MDCK cells expressing a CFP-YFP tandem construct (positive control) and ROI 1 and 2 are the same as in B. Data are summarized in Supplemental Table 1.

