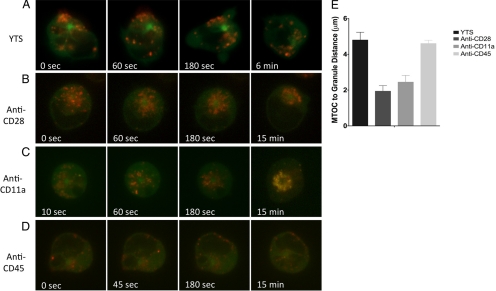
Figure 3.
Dynamics of lytic granule movement to the MTOC in NK cells induced by immobilized antibodies against cell-surface receptors. (A–D) Time-lapse frames from Supplemental Video 4 of lytic granule movement in a YTS GFP-tubulin cell on an uncoated surface (A), YTS GFP-tubulin cell on an anti-CD28-coated surface (B), YTS GFP-tubulin cell on an anti-CD11a-coated surface (C), and YTS GFP-tubulin cell on an anti-CD45-coated surface (D). In each image, confocal immunofluorescence in the plane of the MTOC is shown. Green, GFP-tubulin; red, LysoTracker-loaded acidified lysosomes. Zero seconds represents the time at which the NK cell appears to contact the glass surface. (E) Quantitative analyses of lytic granule movement relative to the MTOC measured by mean MTOC to granule distance in individual time points averaged over all measured time points (error bars, ±SD) in 9–10 YTS cells per condition. Mean distances of lytic granules from the MTOC in NK cells on anti-CD28– and anti-CD11a– but not anti-CD45–coated surfaces were significantly different from unconjugated NK cells (p < 0.05).

