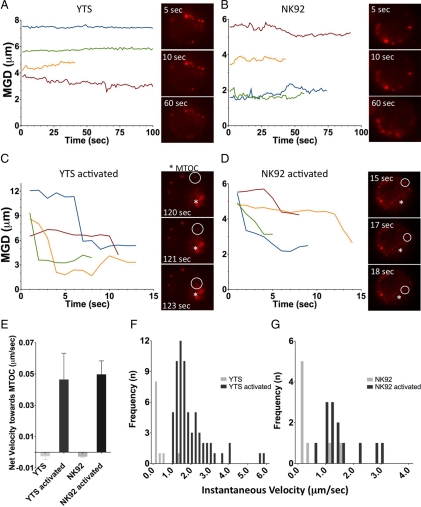
Figure 4.
Quantitative analyses of rapid lytic granule movement relative to the MTOC in NK cells. Distance of individual LysoTracker Red–loaded lytic granules from the MTOC as a function of time in a single cell and as visualized in a streaming video sequences in resting YTS GFP-tubulin (A), or NK92 GFP-tubulin (B) cells, and YTS GFP-tubulin cells on an anti-CD28-coated surface (C) or NK92 GFP-tubulin cells on an anti-NKp30–coated surface (D). Times listed in images represent seconds elapsed after the NK cell contacted the glass surface. The MTOC as defined by GFP fluorescent acquisition (not shown) is marked with an asterisk (*), and a white circle tracks an individual moving lytic granule. The line graphs shown each demonstrate four representative single lytic granule tracks, with T = 0 representing the first identification of that granule. In activated NK cells these had a total displacement of >1 μm as did >50% of all granules identified. (E) Mean net velocity of all measured lytic granules over their entire tracks (error bars, ±SD). Each bar represents three cells accounting for 58–141 measured lytic granule tracks; means in activated YTS and NK92 cells were significantly different from resting cells (p = 0.045 and p = 0.0036, respectively). Histogram of instantaneous velocities of all MTOC-directed lytic granules in YTS GFP-tubulin (F) and NK92 GFP-tubulin cells (G), as they moved toward the MTOC with a displacement of ≥1 μm. Instantaneous velocities in activated YTS and NK92 cells were significantly different from those in resting cells (p < 0.0001 and p = 0.0035, respectively).

