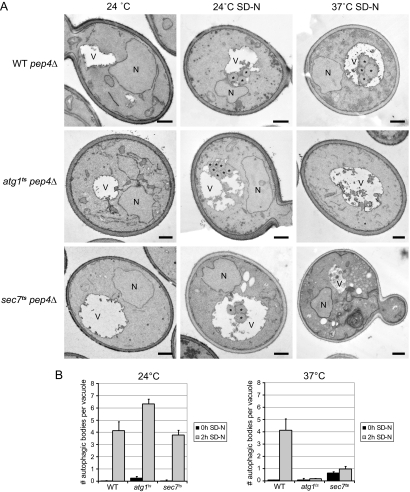
Figure 2.
Electron microscopy analysis of WT, atg1ts, and sec7ts cells in nutrient rich and starvation conditions. (A) WT pep4Δ (TVY1), atg1ts pep4Δ (the YTS113 strain transformed with the plasmid expressing Atg1ts), and sec7ts pep4Δ (AVY004) cells were grown in rich medium at 24°C to an early log phase and then transferred to the SD-N medium for 2h at either 24 or 37°C. In parallel, cells were also placed at 37°C for 2 h. Culture aliquots were collected at the beginning and at the end of each incubation and processed for EM as described in Materials and Methods. (B) Quantification of the accumulated autophagic bodies. The results are expressed as the average number of autophagic bodies per vacuole. Error bars represent the SD in the counting of two different grids. N, nucleus; V, vacuole; *, autophagic body. Bar, 500 nm.

