Figure 10.

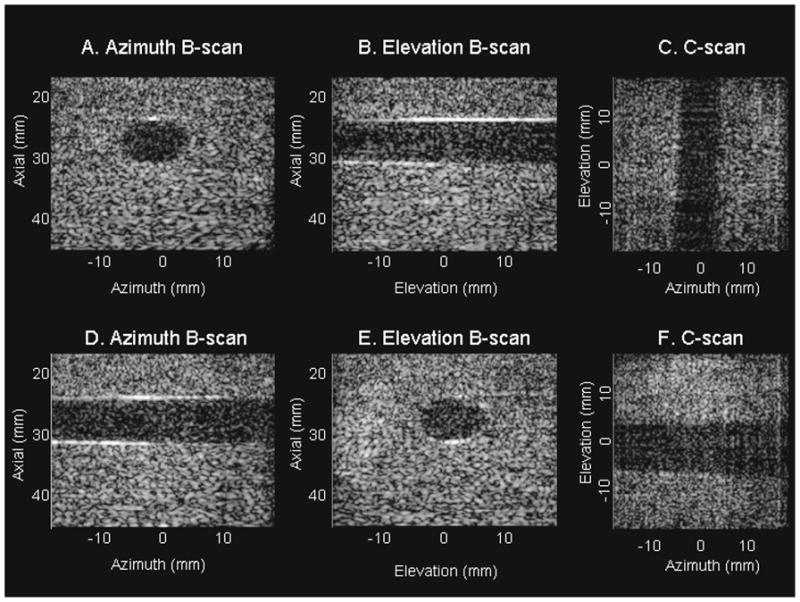
Experimental cyst images with the cyst short-axis in azimuth (A–C) and the cyst short axis in elevation (D–F). All images are log-compressed and shown with 30 dB dynamic range.

Experimental cyst images with the cyst short-axis in azimuth (A–C) and the cyst short axis in elevation (D–F). All images are log-compressed and shown with 30 dB dynamic range.