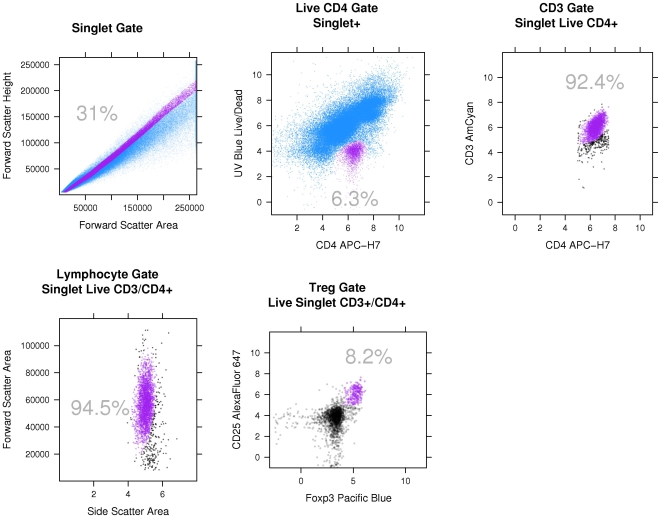
Figure 1. Representative gating strategy for identification of CD3+CD4+CD25hiFoxp3+ lymphocytes and subsets.
Gated cells (selected cells) are purple, while non-gated cells (discarded cells) are blue or black. The gating involves sequential boolean filters and the sequence of filters is demonstrated here moving left to right and then top to bottom. Purple cell populations are selected in each scatterplot and this population is then used as the parent population in the subsequent scatterplot. (top row) First, singlets are identified in a forward scatter-area vs. forward scatter-height plot and gated on prior to logicle transformation of the data. Live/CD4+ cells are then identified in a CD4 vs. UV-Blue plot. CD3+ cells are then identified in a CD4 vs. CD3 plot. (bottom row) Lymphocytes within this population are identified in a side scatter-area vs. forward scatter-area plot. Treg are identified in a Foxp3 vs. CD25 plot. Determination of gates for CD25, CD45RA, Foxp3 and CCR7 utilized fluorescence minus-one (FMO) tubes.

