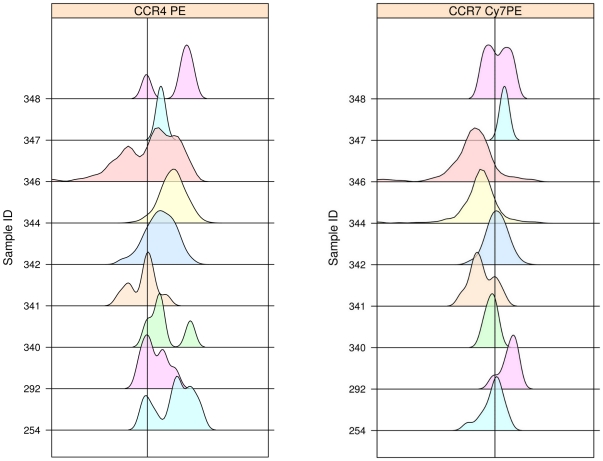
Figure 5. Density plots of chemokine receptor expression by Treg.
Representative density plots of CCR4 and CCR7 expression by BALF Treg. The parent populations for determination of chemokine receptor positivity were singlet, live, CD3+CD4+CD25hiFoxp3+ lymphocytes as shown in Figure 1. (left) Demonstrates the generally high level of CCR4 expression by Treg. The CCR4 gate was determined such that <0.1% of the cells were positive in the CCR4 FMO tube (see text for detail). (right) Demonstrates the variability of CCR7 expression by Treg. The CCR7 gate was determined such that <0.3% of the cells were positive in the CCR7 FMO tube.

