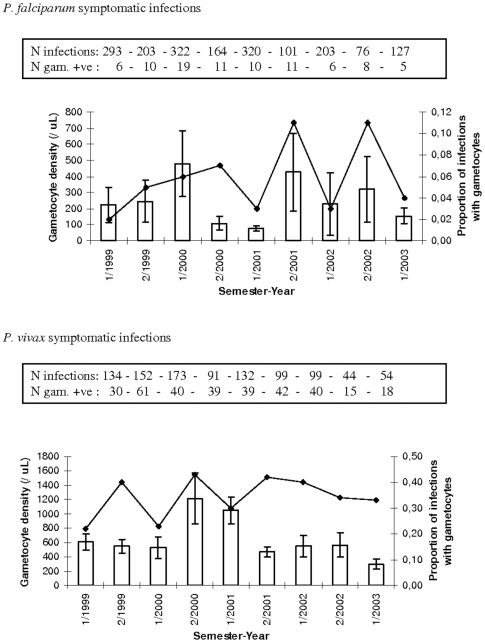
Figure 3. Gametocyte prevalence (line plot) and density (histogram) in symptomatic infections by semester-year in Suan Phung.
1/“year” indicates the first semester and 2/“year” the second semester of each year. Shown are means and SE for gametocyte density. Given in the boxes are the corresponding number of infections of P. falciparum or P. vivax and the number of these that were positive for gametocytes (and hence used to calculate the gametocyte densities).

