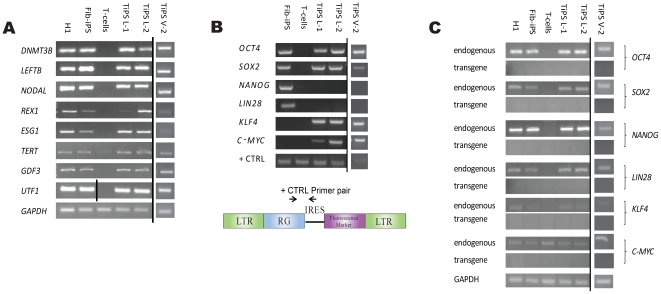
Figure 3. Characterization of induced pluripotent stem cells from human T-cells.
(A) RT-PCR analysis of representative leukapheresis (“TiPS L-1” and “TiPS L-2”) and Vacutainer (“TiPS V-2”) derived TiPS cell lines for expression of hES cell-marker genes DNMT38, LEFTB, NODAL, REX1, ESG1, TERT, GDF3, and UTF1. GAPDH was used as positive loading control for each sample. (B) PCR analysis of genomic DNA confirms integration of the transgenes. Forward primers for the reprogramming gene (“RG”) of interest and reverse primers for the IRES were utilized. OCT4 forward and reverse primers were used as the PCR reaction positive control, as shown in vector map. (C) RT-PCR analysis of TiPS cell lines shows silencing of the exogenous transgenes, with GAPDH as positive control for each sample. In (A) and (C) hESC line H1 and in (A-C) a fibroblast derived iPSC line (“Fib-iPS”) served as positive cell controls, and activated donor T-cells served as a negative cell control. In (A-C) images were modified with Photoshop software to combine gels and remove redundant control data from separate experiments.

