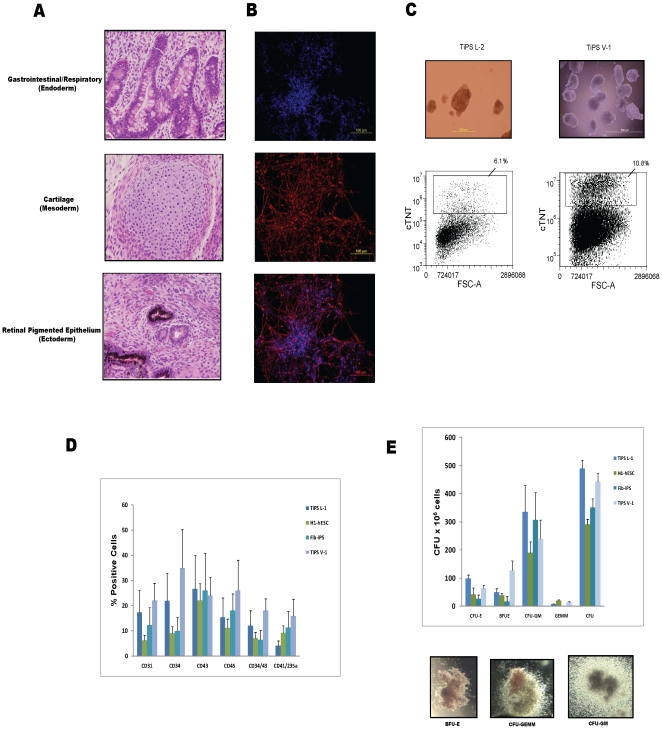
Figure 4. In vivo and in vitro differentiation potential of TiPS cell lines.
(A) Teratoma formation shows in vivo differentiation potential. TiPS cells injected into SCID/beige mice formed teratomas at 5 to 12 weeks. Hematoxylin and eosin staining shows tissues consistent with derivation from the three primary germ layers including simple epithelium with goblet cells indicating gastrointestinal or respiratory tissue (endoderm), cartilage (mesoderm) and retinal pigmented epithelium (ectoderm). Representative images from TiPS L-2 cell line were acquired using an Olympus IX71 microscope using a 40× objective. (B) In vitro differentiation into neurons. TiPS L-2 cells were induced into neuronal differentiation as aggregates then stained for neuronal marker beta III-tubulin with an Alexa Fluor 594 secondary antibody; cell nuclei were counterstained with Hoechst stain. Images were acquired using a 20× objective. Contrast was adjusted and images were merged using Image J software. (C) Cardiac induction of TiPS cells via cell aggregate method. Cell aggregates contain beating cardiac troponin T (cTNT)-positive cardiomyocytes at days 14 to 15. Flow data from representative samples is shown. Images were acquired using a 10× objective. (D) In vitro differentiation into hematopoietic progenitor cells. Hematopoietic progenitor cells (HPCs) generated via a serum-free embryoid body (EB) differentiation protocol for 12 days in two TiPS lines compared to an hESC line (“H1”) and a fibroblast derived iPSC line (“Fib-iPS”). HPCs were quantified via flow cytometry by dissociating the EBs into single cells and staining with fluorochrome-conjugated monoclonal antibodies to CD34, CD45, CD43, CD31, CD41 and CD235a. (E) Hematopoietic clonogenic (CFU) assays were performed by placing EB differentiated and individualized cells into serum-free MethoCult media containing cytokines (SCF, G-CSF, GM-CSF, IL-3, IL-6, and EPO). Colonies were scored after 14 days of incubation according to morphologic criteria as erythroid (CFU-E/BFU-E), myeloid comprising macrophage (CFU-M), granulocyte (CFU-G), and granulocyte-macrophage (CFU-GM), and multilineage comprising granulocyte-erythroid-macrophage-megakaryocyte (CFU-GEMM) colonies. Total CFUs were quantified and representative images were acquired using an Olympus CKX41 microscope with a 2× objective.

