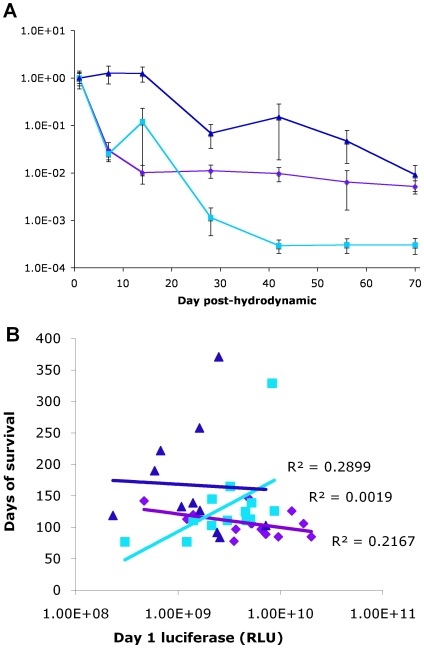
Figure 4. Luciferase expression and the relationship between initial expression values and long-term survival.
(a) TRE-MYC/LAP-tTA transgenic mice given pCS/pLiLucB (purple diamonds), pCSmI/pLiLucB (cyan squares), or pCSI/pLiLucB (blue triangles) by hydrodynamic injection were imaged at Day 1, Week 2, 4, 6, 8, and 10. The normalized luciferase levels were obtained by dividing the average luciferase expression in reflective light units (RLU) at each time point by the average level at day 1 for that group. Propagation of errors was used to determine the standard error at each time point given the division calculation (error bars). By student's t-test of the values at day 70, the pCSI/pLiLucB group and pCS/pLiLucB group had a p-value of 0.067, while the pCSI/pLiLucB group and pCS/pLiLucB group were significantly higher than the pCSmI/pLiLucB group (p = 0.014 and p = 0.000031, respectively). (b) Each mouse is represented by one point on the scatterplot, using the day 1 luciferase value in reflective light units (RLU) as the x-coordinate and the days of survival as the y-coordinate. The symbols and colors are identical to those used in a. The linear line-of-best-fit was calculated by GraphPad Prism and is plotted for each group (R-squared values of pCS/pLiLucB, 0.1065; pCSmI/pLiLucB, 0.3839; pCSI/pLiLucB, 0.0033). No R-squared values exceeded 0.95, which would have indicated that there was a trend relating transfection efficiency and survival.

