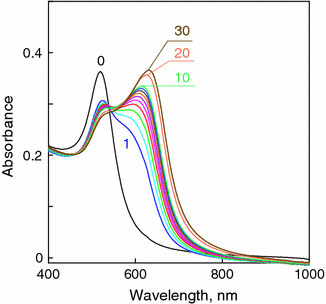
Figure 1.

Time-dependent absorption spectra of NPs–Gm mixture (1:1 v/v). The final concentration of NPs and Gm are 0.15 mM and 0.05 μg mL−1, respectively. Thenumbersnear curves designate the time after mixing (seconds), thecurve 0is the initial spectrum without Gm
