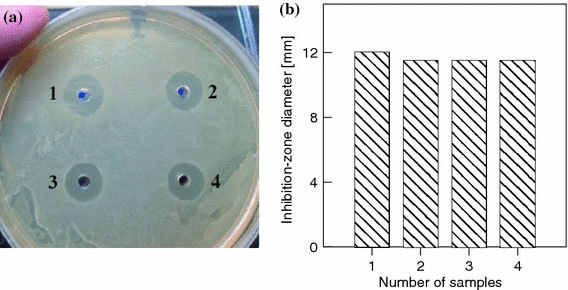
Figure 4.

aZones of inhibition of the growth ofE. coliK12 upon application of gentamicin (1) and gentamicin–NP mixtures at particle concentrations of 0.1 (2), 0.5 (3), and 1.0 mM (4).bA diagram showing the averaged inhibition-zone diameters for samples 1–4
