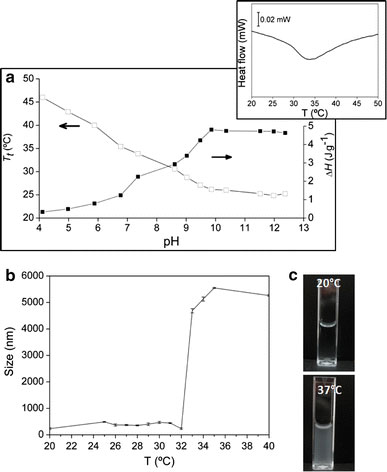
Figure 2.

aTransition temperature (□) and enthalpy (■) obtained from DSC scans; inset represents DSC curve for pH = 7.36;baggregation size profile obtained from size measurement andcturbidity change of the solution used for size determination

aTransition temperature (□) and enthalpy (■) obtained from DSC scans; inset represents DSC curve for pH = 7.36;baggregation size profile obtained from size measurement andcturbidity change of the solution used for size determination