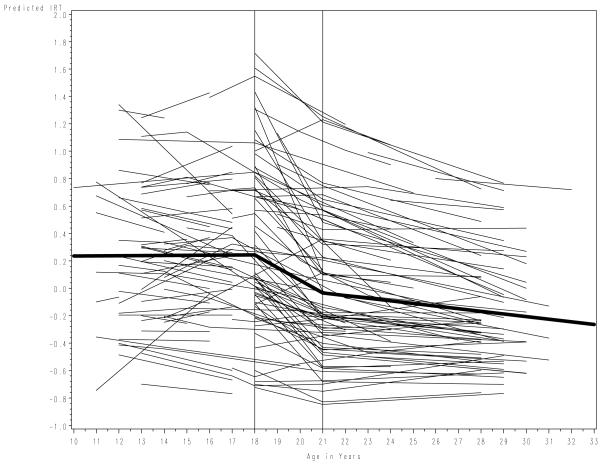
Figure 4. Fixed effects and a random sampling of individual trajectories drawn from the final three-piece linear growth model fitted to the 7392 observations drawn from 1827 individual subjects.
note: dark line represents fixed effects for the three linear pieces; the vertical reference lines at age 18 and 21 denote the points at which the pieces are tied; the intercept is defined at age 21; the individual trajectories are empirical Bayes estimates of a random subset of individuals drawn from all three studies.

