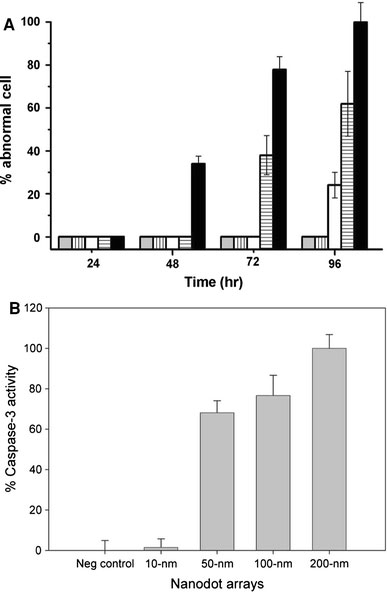
Figure 3.

Apoptosis occurred in cells cultured on nanodot arrays.aThe percentage of cells with abnormal morphology calculated from SEM images. Bars depict percent apoptotic cells grown on the flat silicon surface (gray), 10-nm nanodot array (vertical line), 50-nm nanodot array (empty), 100-nm nanodot array (horizontal line), and 200-nm nanodot array (filled).bCaspase-3 activity for cells cultured 96 h on the nanodot arrays. Values were averaged from six sets of independent experiments and were expressed as mean value ± standard deviation
