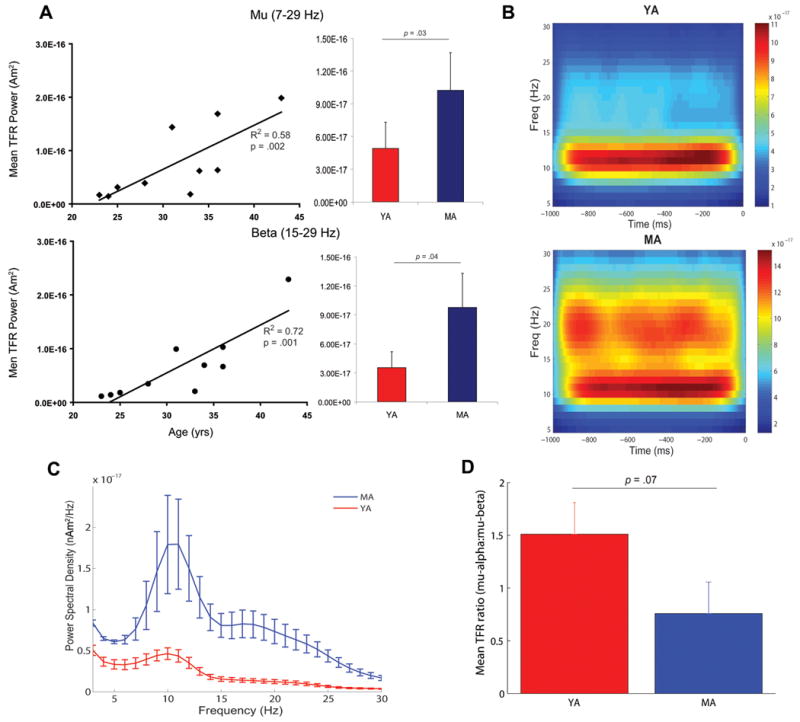
Figure 1. Age-related changes in MEG SI mu rhythms.

A, Left panels Regression plots of prestimulus power in the mu (7-29 Hz, top) and mu-beta (15-29 Hz, bottom) ranges calculated from TFR spectrograms as a function of age. Significant correlations (p < 0.05) are indicated by solid regression lines. Right panels. Bar plots of mean and s.e. for time-averaged TFR power (1 sec, n=200 trials) in each frequency range for the YA (red) and MA (blue). B. Average prestimulus TFRs for the YA (top) and MA (bottom). The unit of power is (Am)2. C. Average prestimulus power spectral density plots for the YA (blue) and MA (red), s.e. bars. D. Mean (+ s.e.) TFR ratios of mu-alpha to mu-beta power for the YA (red) and MA (blue). The TFR ratio was > 1 for YA and < 1 for MA (p = 0.07).
