
Figure 3. Age-related difference in the early MEG SI evoked response.
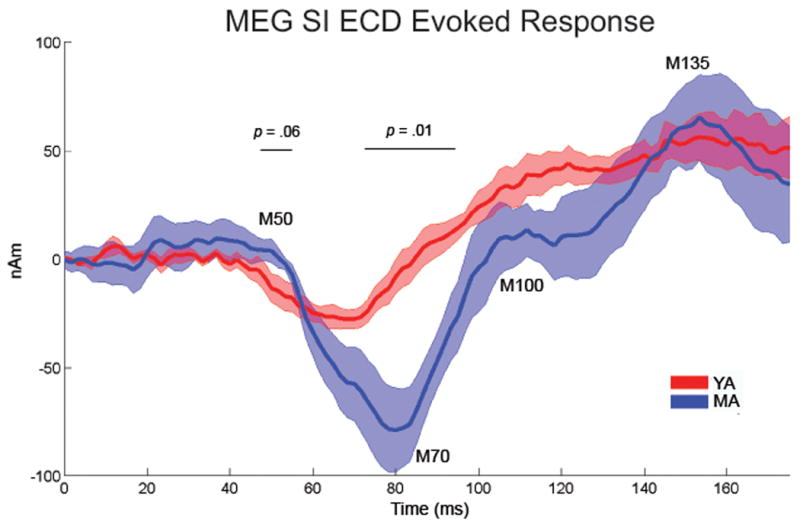
Evoked SI ECD responses for the first 175 ms after stimulation for the YA (red) and MA (blue) (shaded region depicts s.e.). The MA group showed a significantly greater magnitude M70 peak (p = 0.01), longer latency of this peak (p = 0.03), and trends toward a greater ∼50ms response (p = 0.06) and slope from the M70 to 100 ms response (p < 0.09).