
Figure 7. Simulating age-differences in the SI mu rhythm.
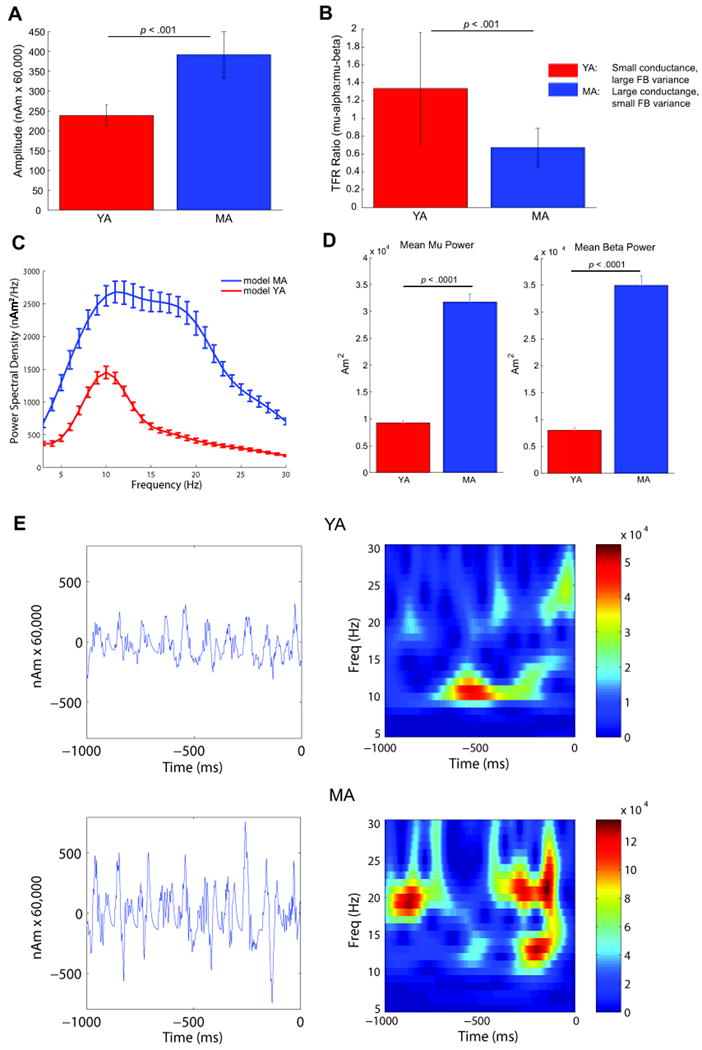
Using the parameter regime outlined in Table 1, the computational model was able to reproduce each of the observed group comparison age-related characteristics of the MEG data: When averaging over multiple trials (n=25 each group), the model reproduced A) larger mean amplitudes of oscillations in the MA model data, and B) a TFR mu-alpha to mu-beta ratio >1 for YA and <1 for MA. C. Average power spectral density plots for the modeled YA (blue) and MA (red) data. D. Time-averaged TFR power estimates were significantly larger in the MA simulations in mu and mu-beta range (p<0.001). E. Individual trial waveforms and spectrograms showing single trial variability and symmetric oscillations, with increased amplitude oscillations and greater beta dominance in the simulated MA compared to YA model data (bottom). Panels A-D depict mean and s.e. across trials.