
Figure 8. Simulating age-differences in the SI evoked response.
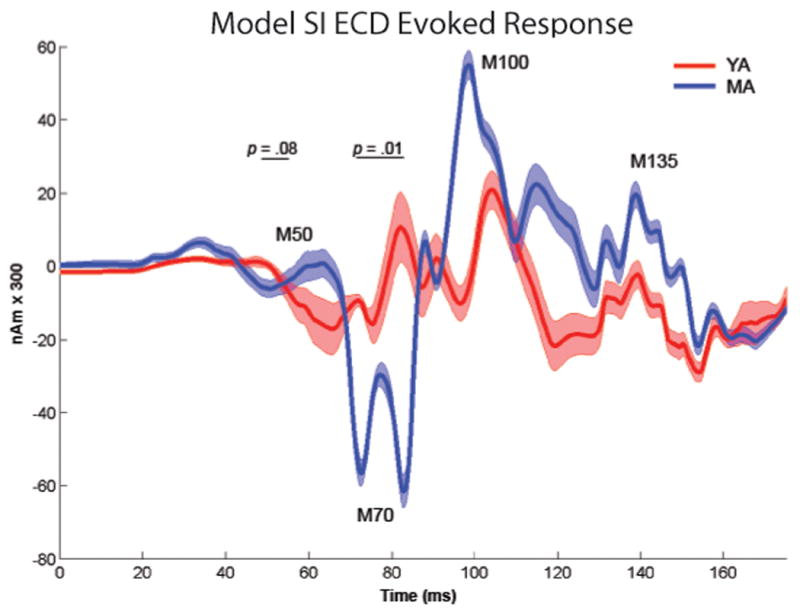
Simulating an evoked response sequence with FF-FB-LFF input, as described in the results, during ongoing YA and MA mu rhythms reproduced the age-differences observed in the MEG evoked response, including a greater magnitude M70 peak (p = 0.01), a greater slope from the M70 to 100ms response (p < .0001) and a trend toward a decreased M50 response (p = 0.08) in the MA simulation. Mean and s.e. shown over n=30 trials per group.